 IFHP
IFHPCommunity Data
Covid-19 Data Commons Toolkit
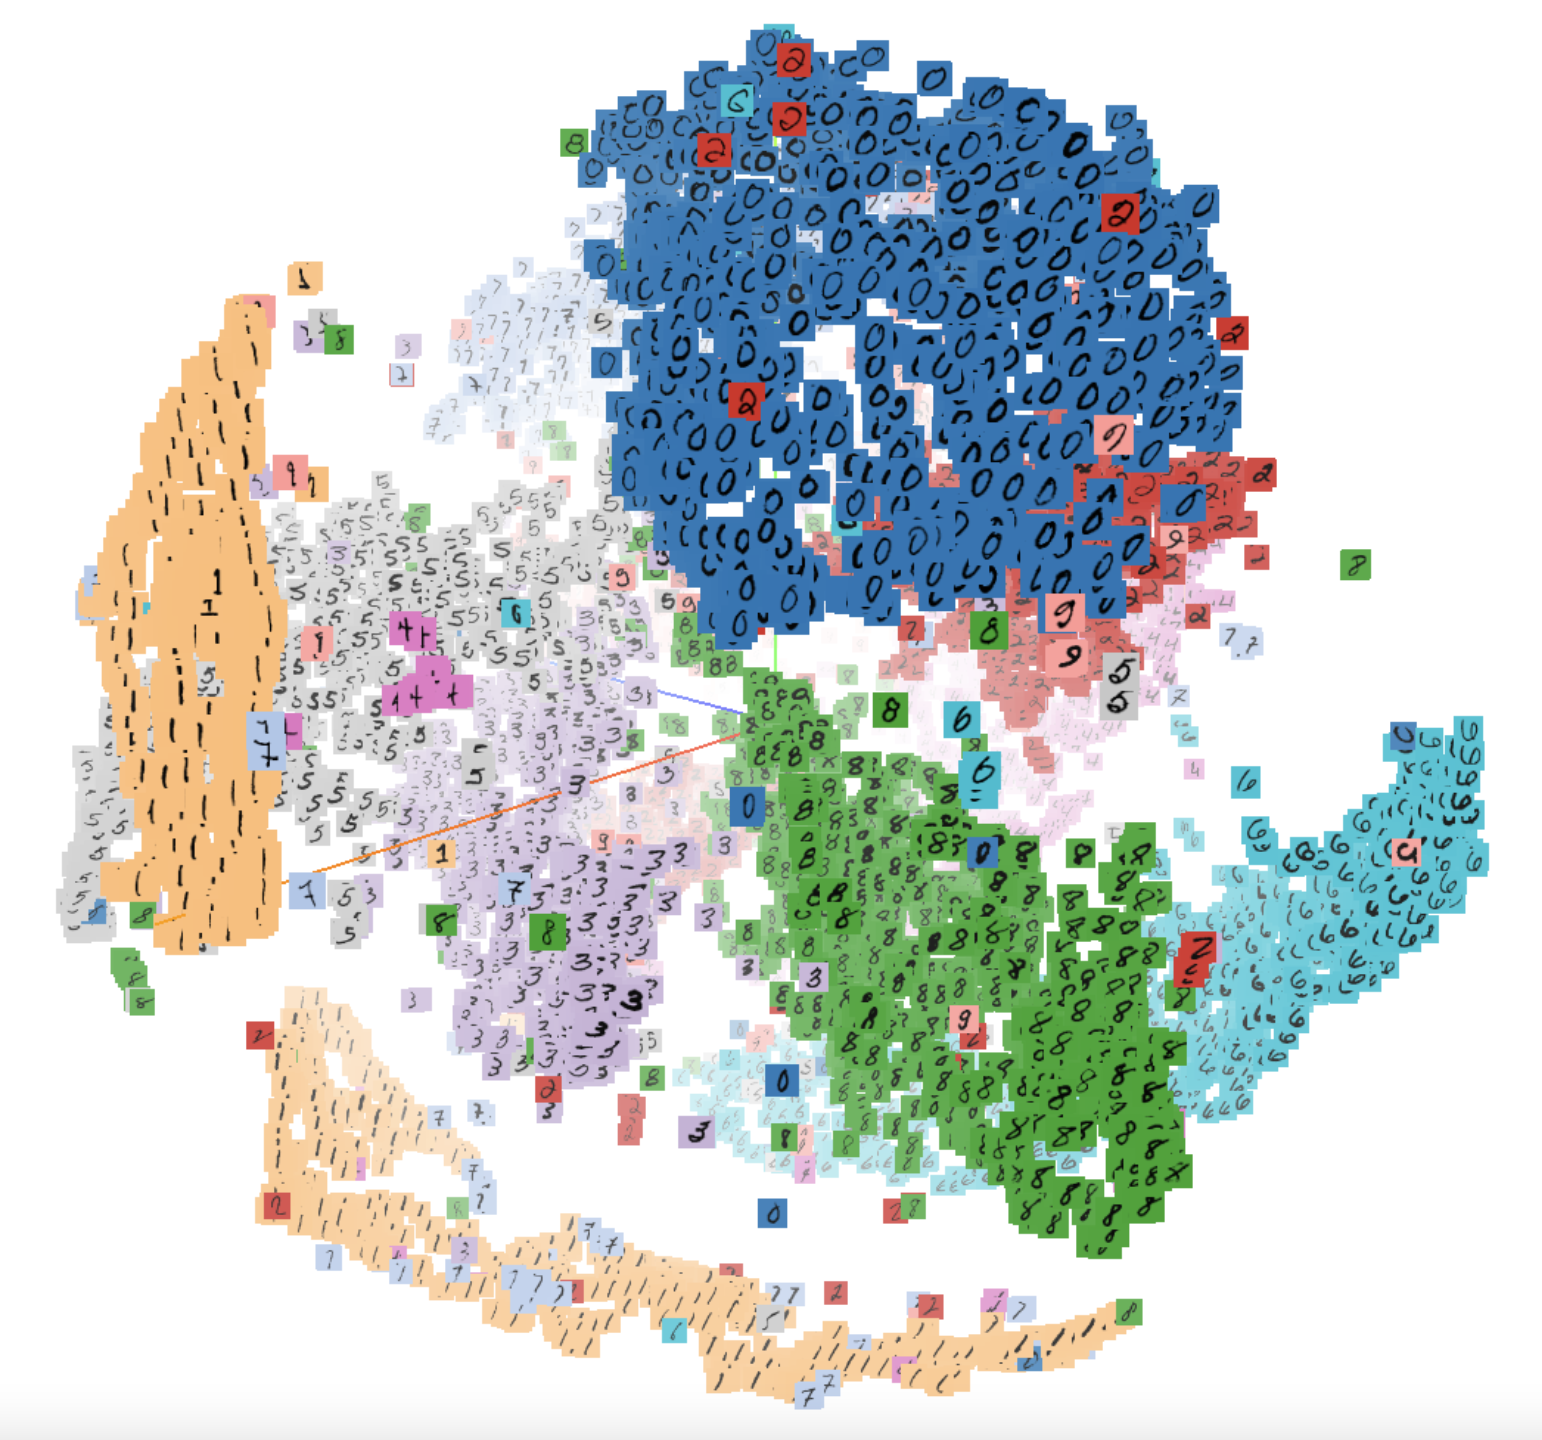
This is a collection of approximately 6000 datasets (after preprocessing) related to covid-19. The T-SNE plot is presented to visualize the BioBert embeddings created using the abstracts of the datasets. There are multiple interesting clusters formed in the dataset related to keywords like vaccine, icu, etc which we are exploring.
Exploratory Data Analysis
This collection of approximately 26554 datasets, post preprocessing, concerning COVID-19 was sourced from Figshare and Zenodo FAIR Stations. Users can utilize this resource to conduct Exploratory Data Analysis and freely download the data according to their preferences.
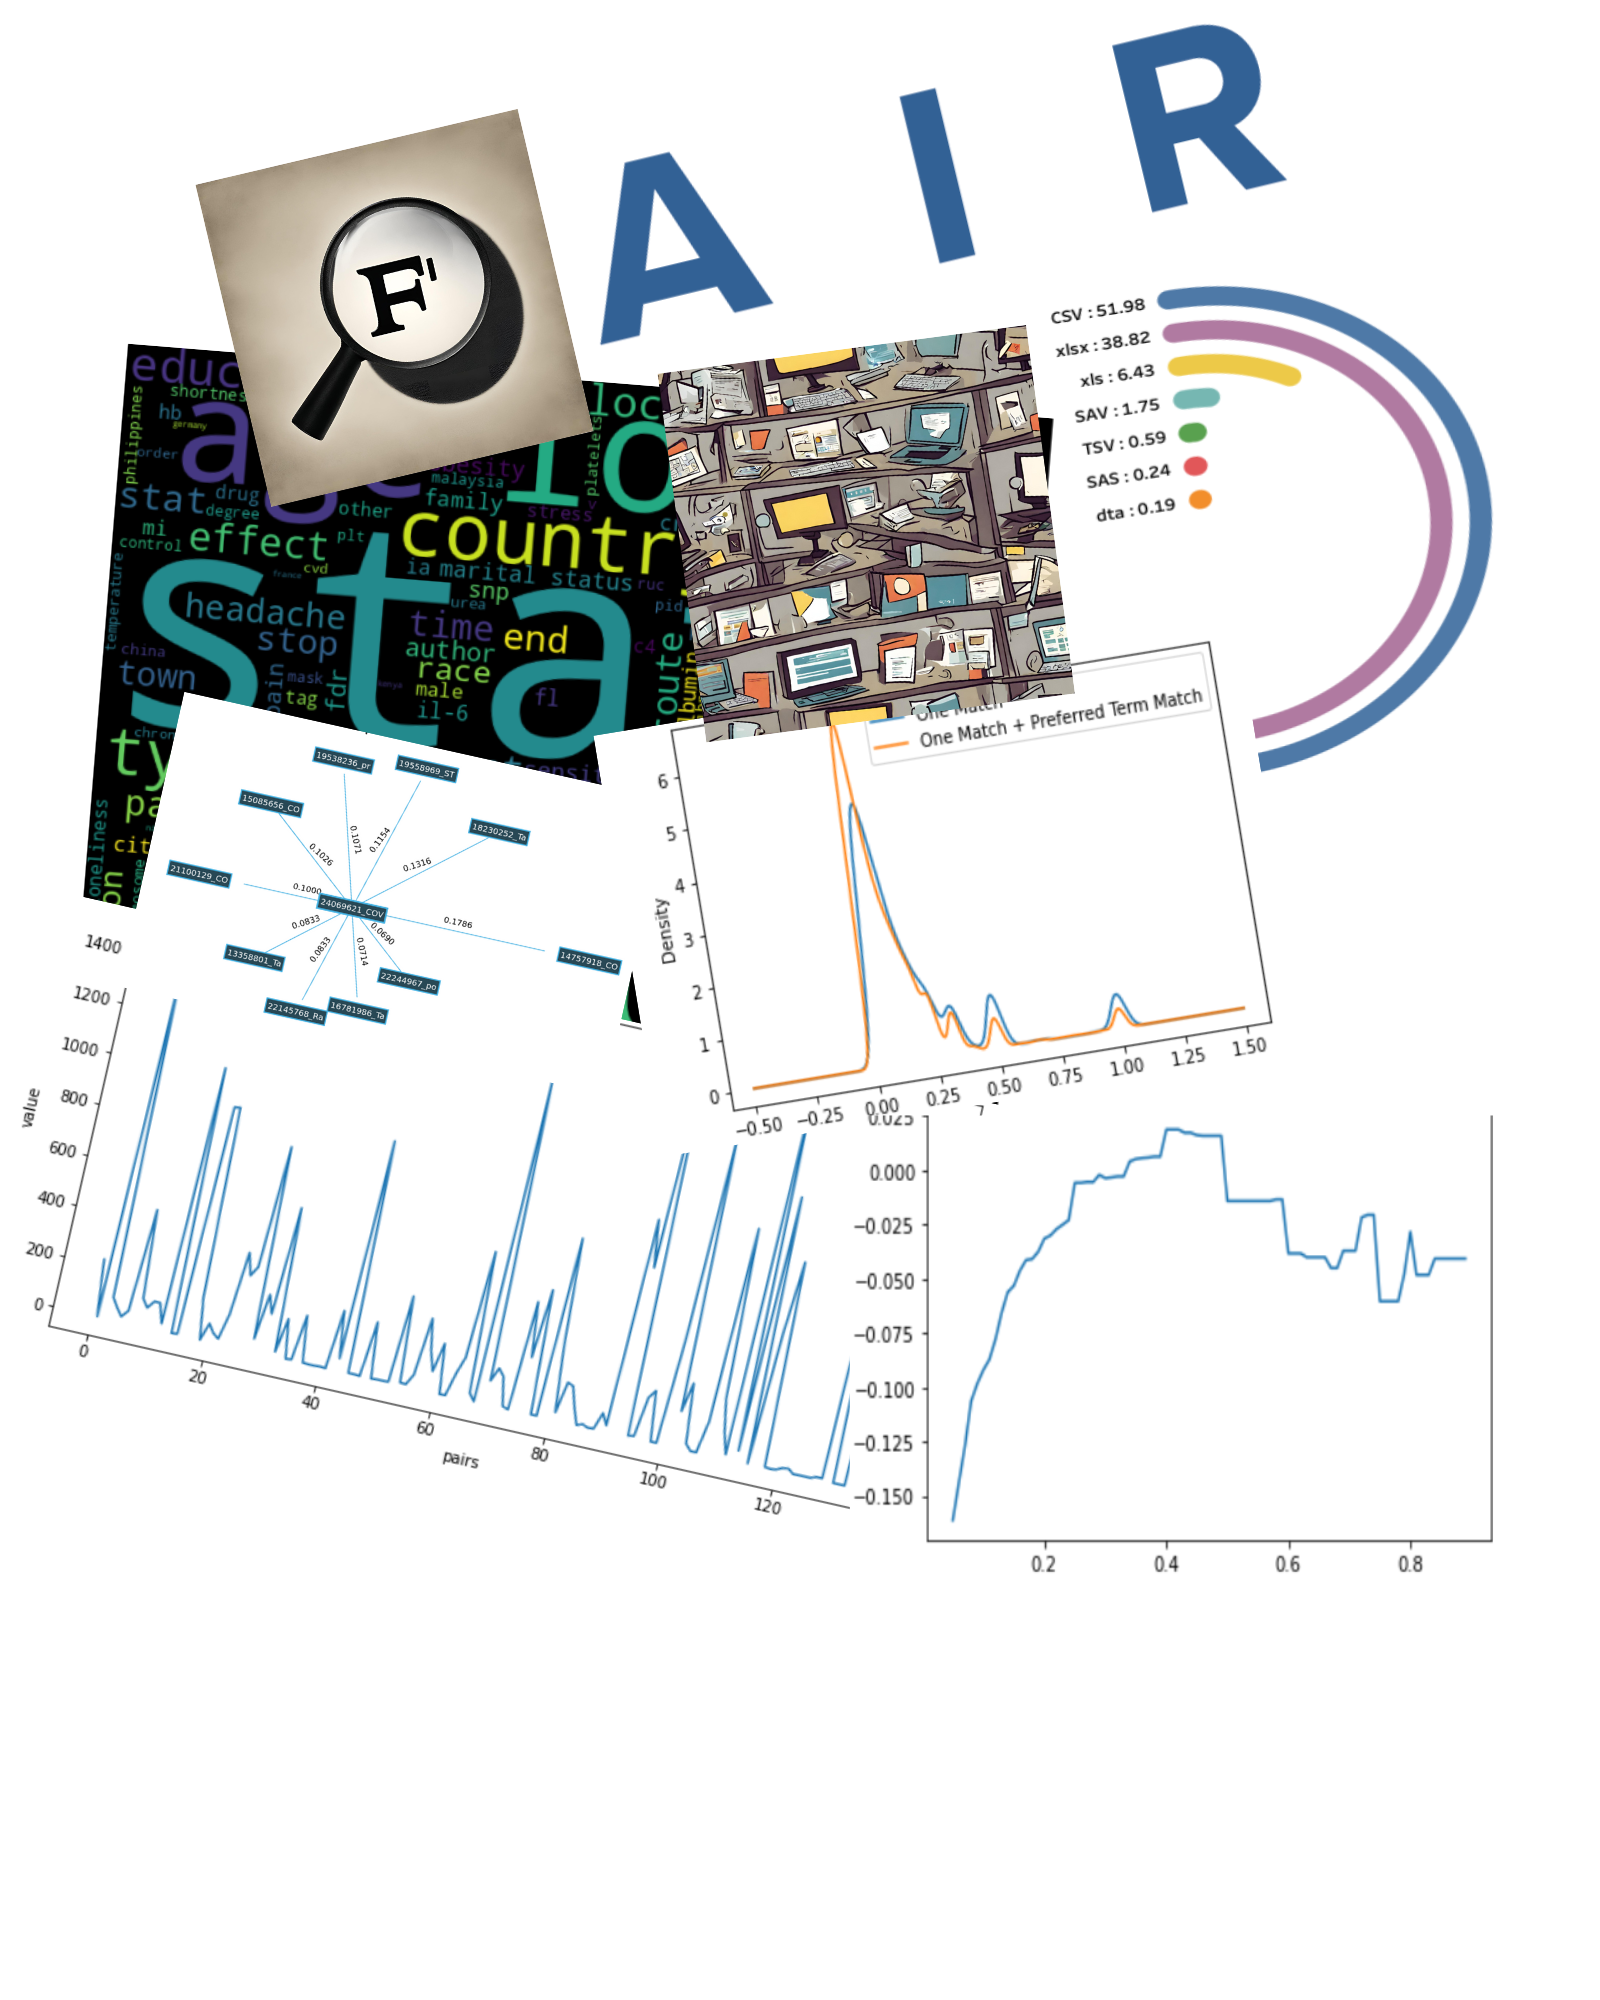
Harmonising FAIR DataHub
There are three levels of analysis to select from: data level, field (column names), and description. Next, choose your preferred FAIR station. Select data based on the keyword. Decide whether to view mapped terms, CSV, or closely related files based on similarity score. Additionally, the similarity ratings at various levels between two files are available.
Select Analysis Type:
To choose new files click on the reset button